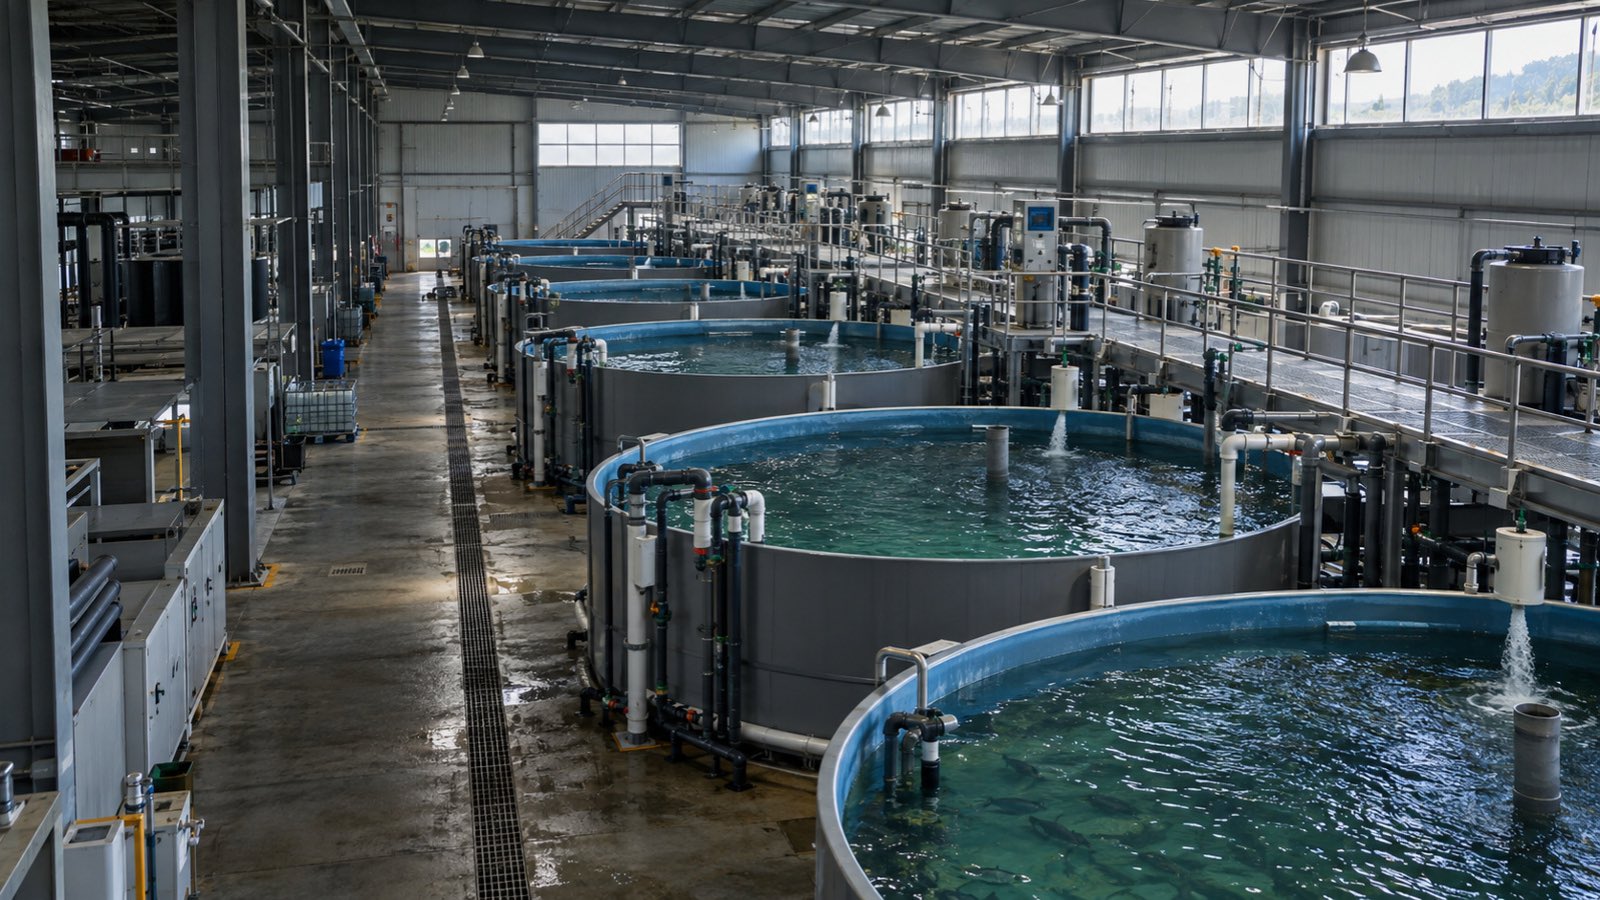
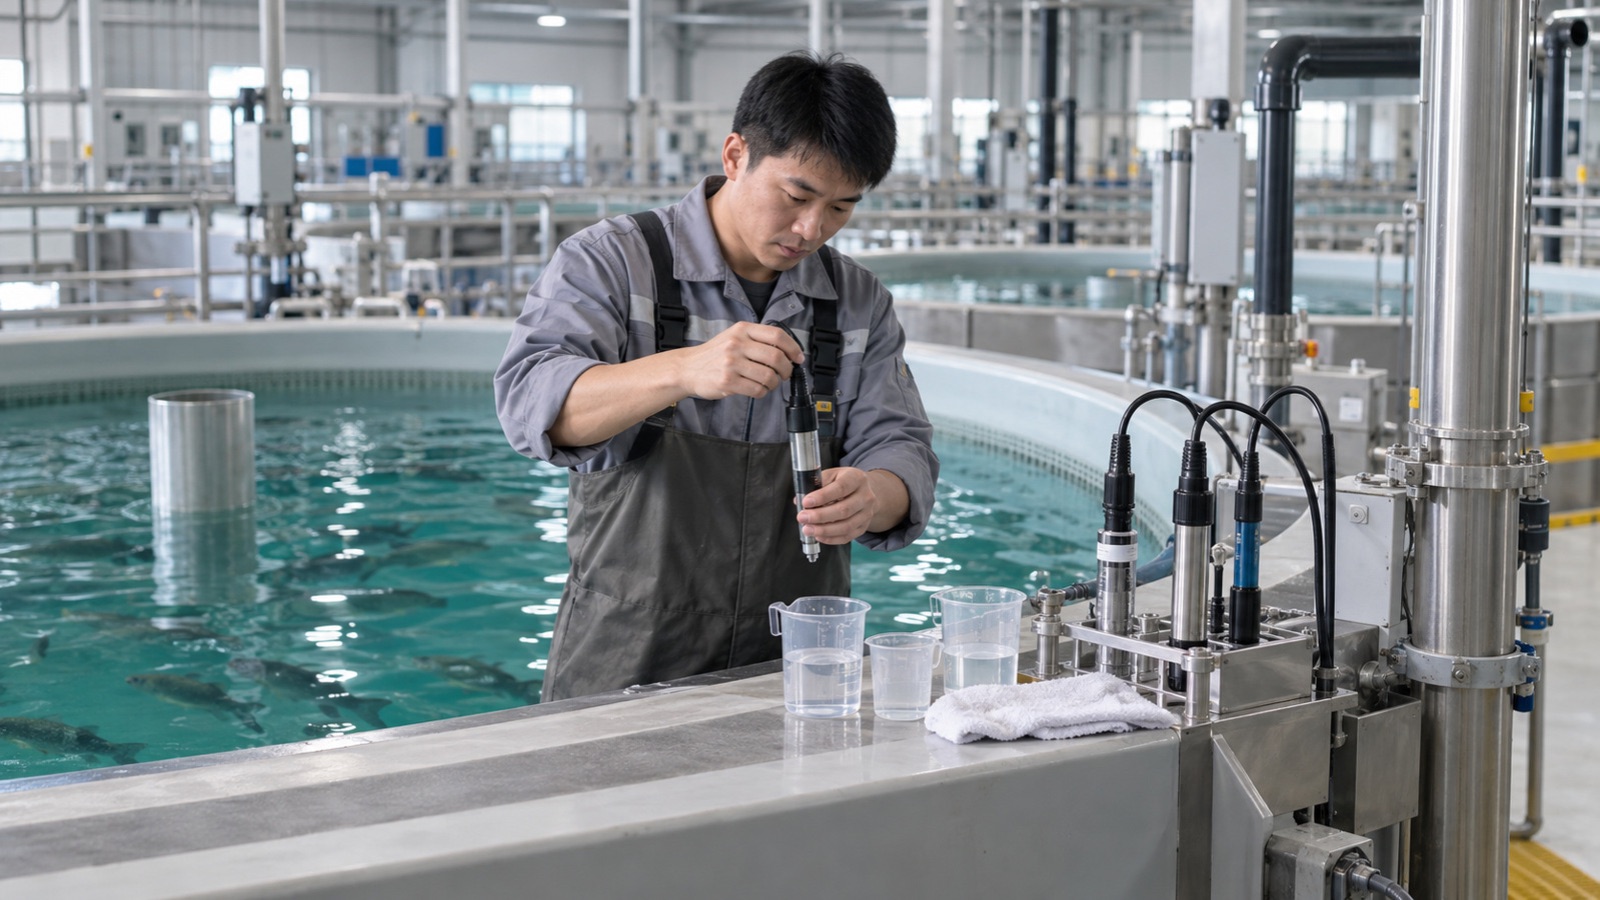
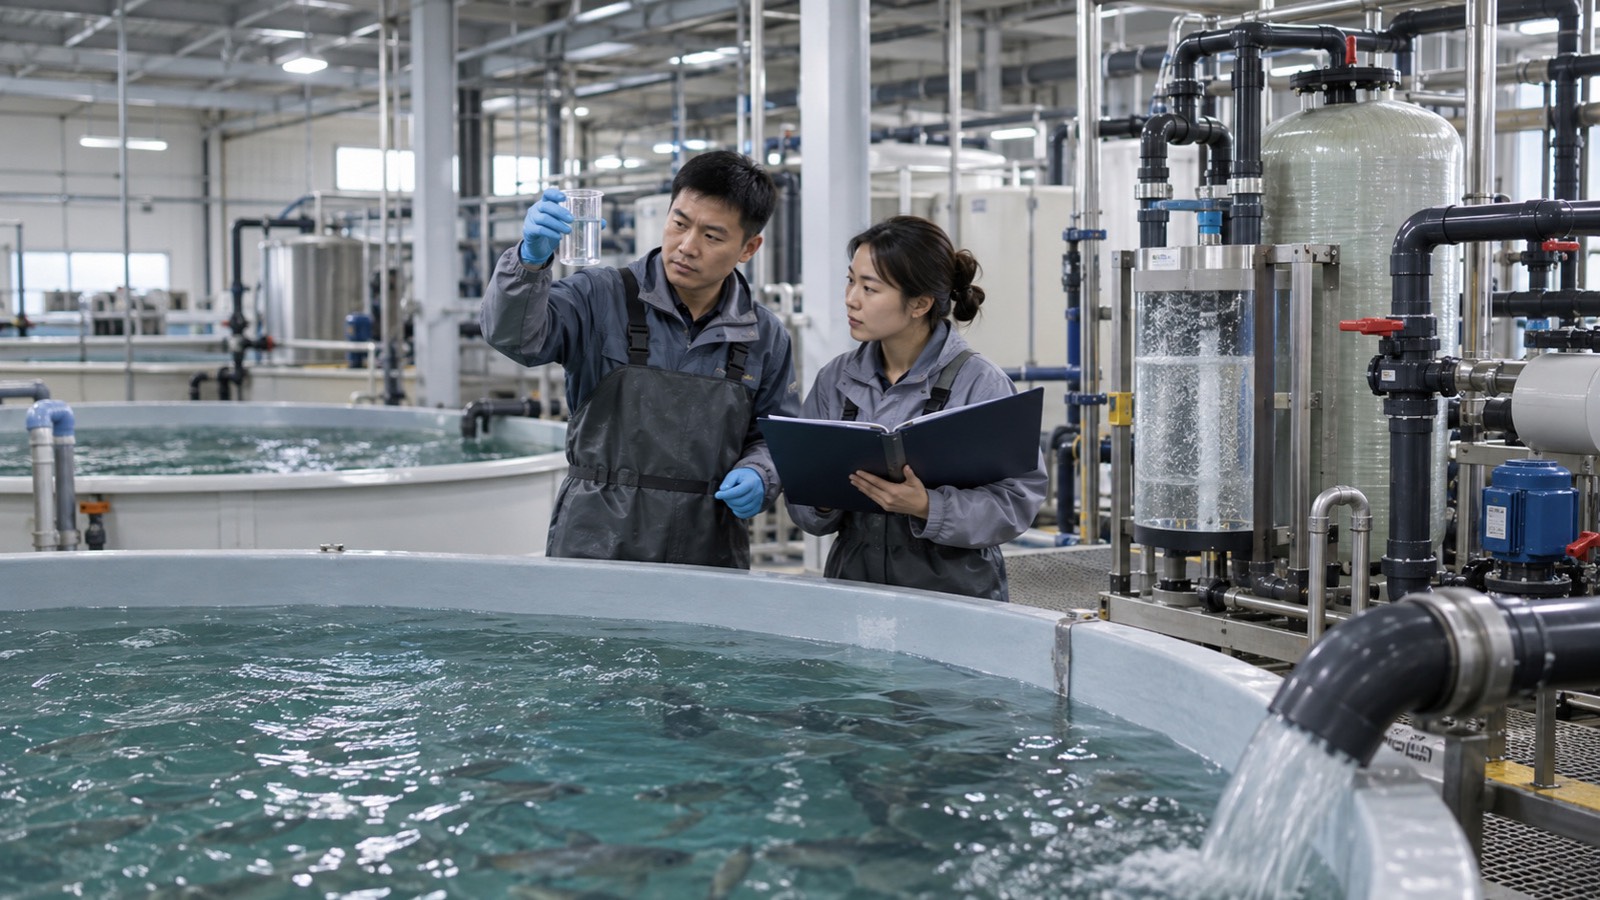
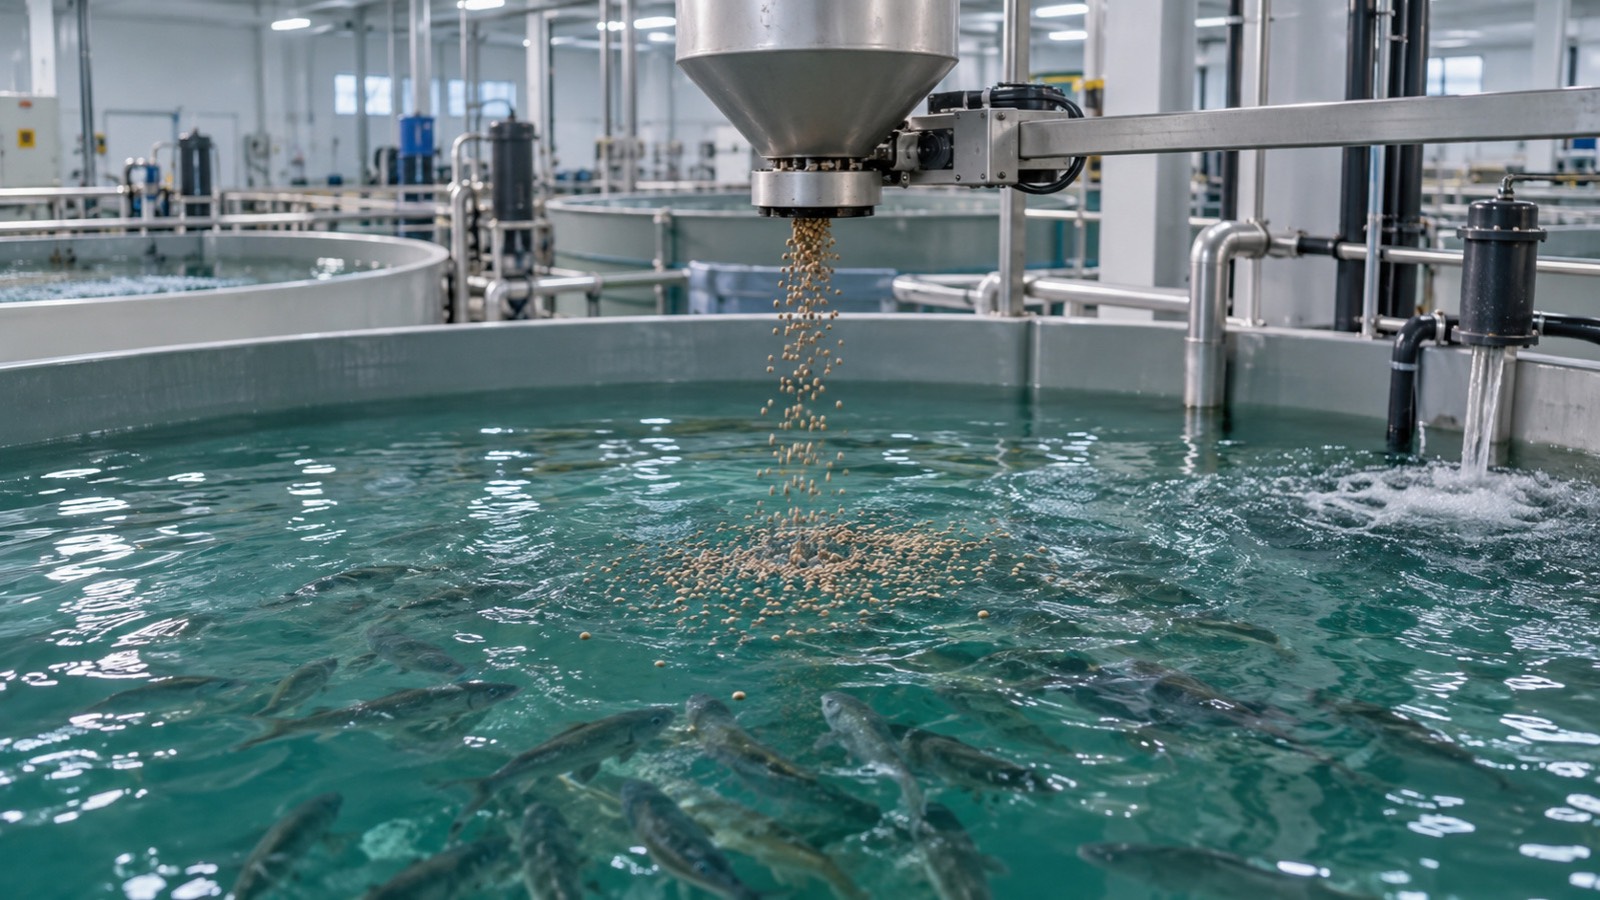
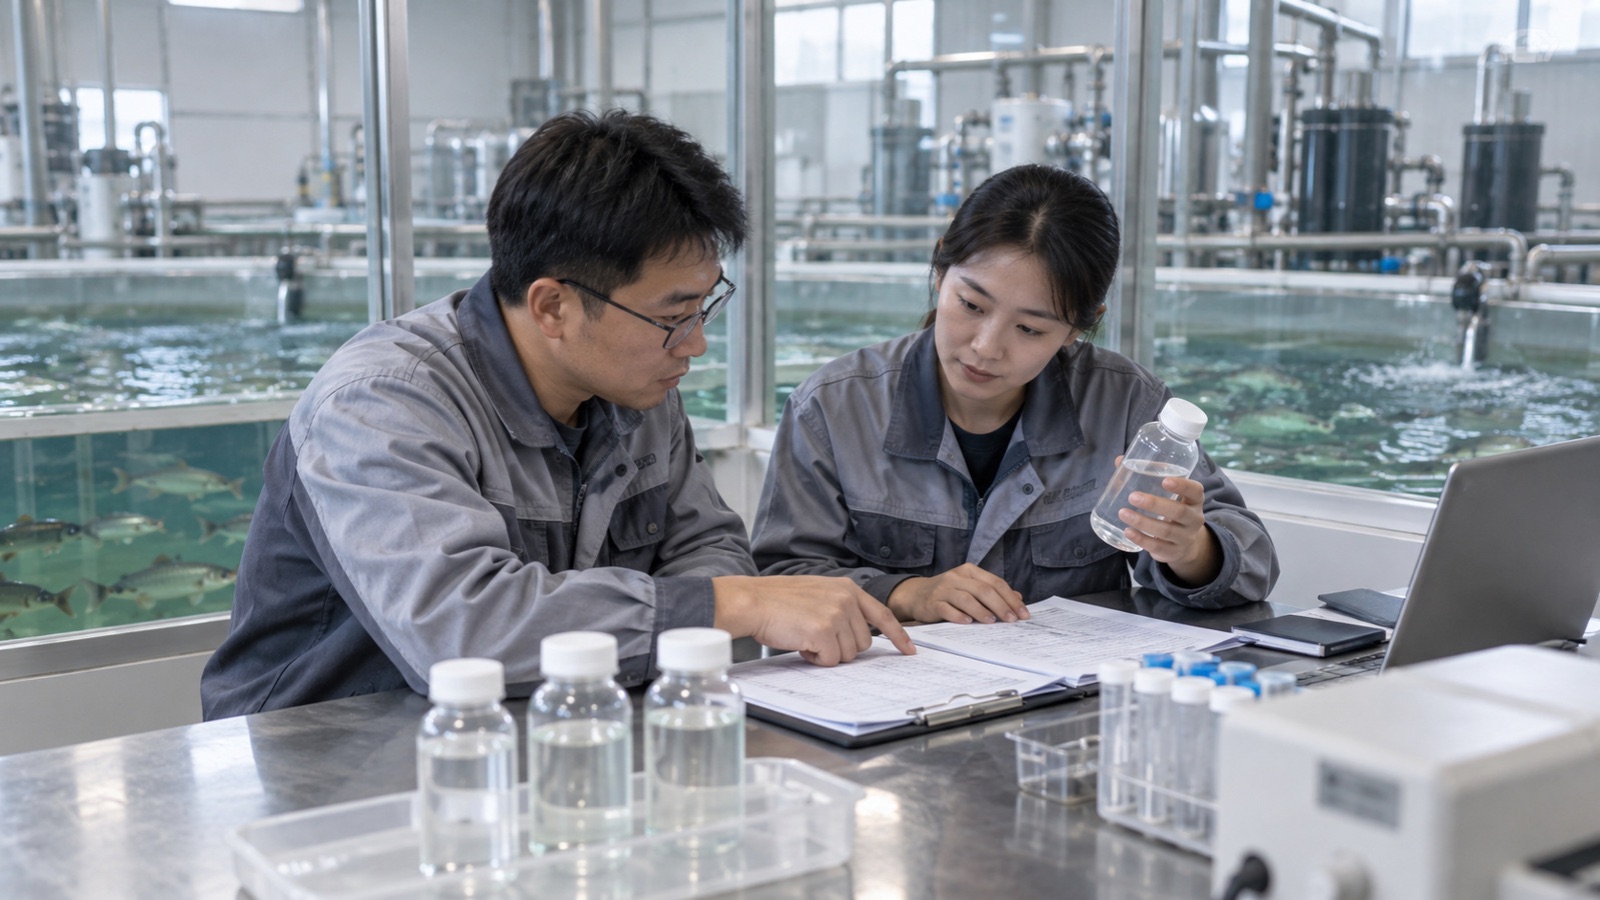
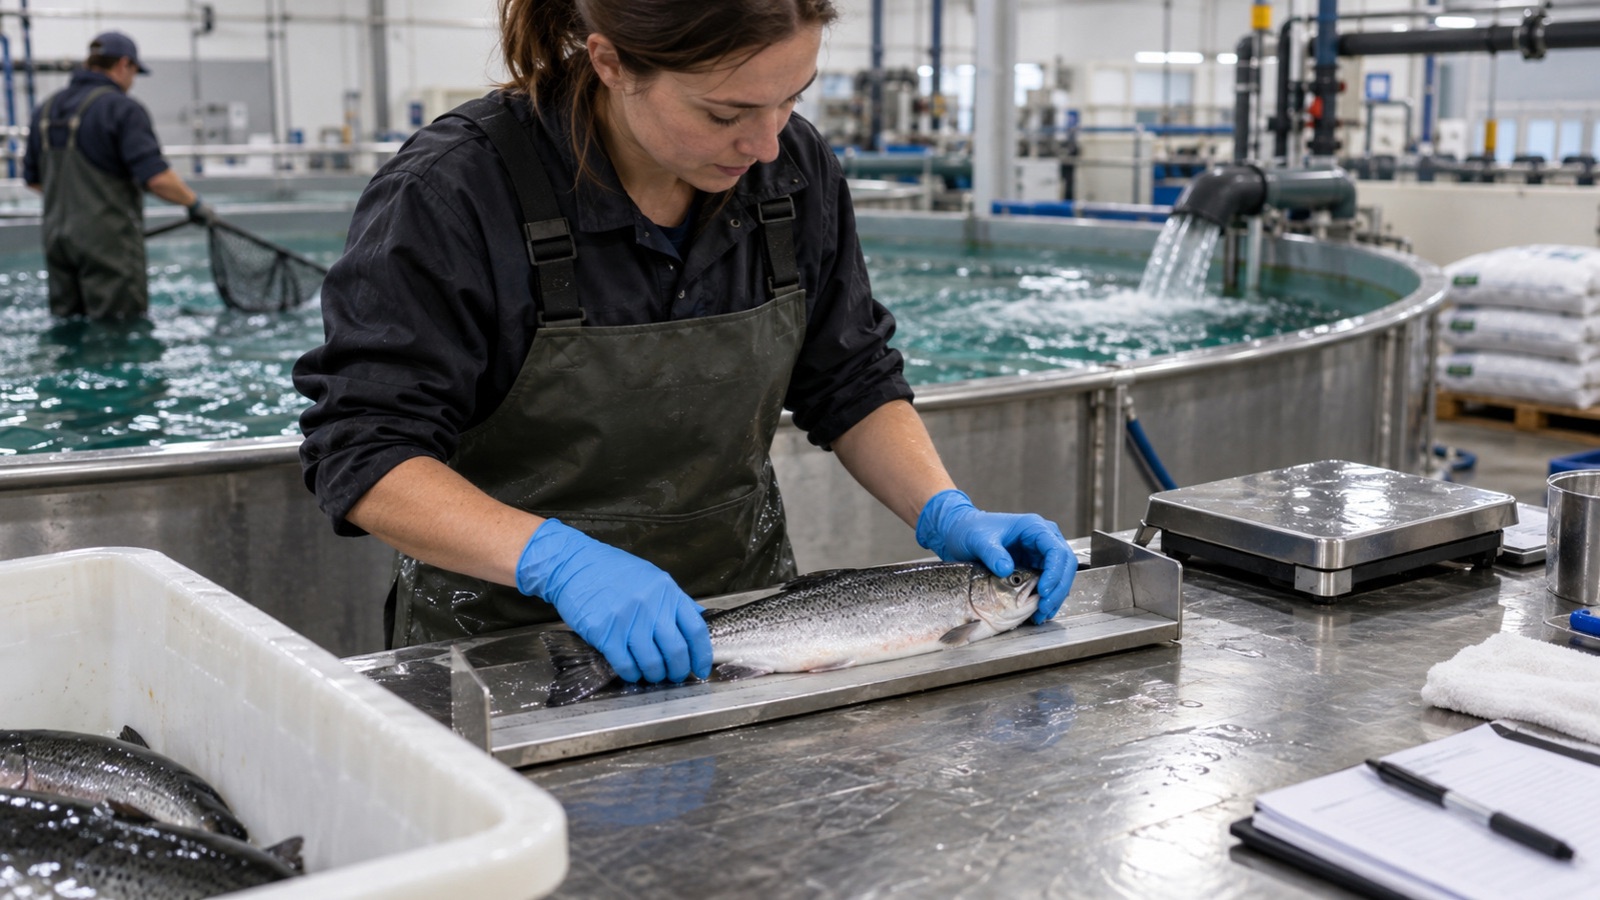
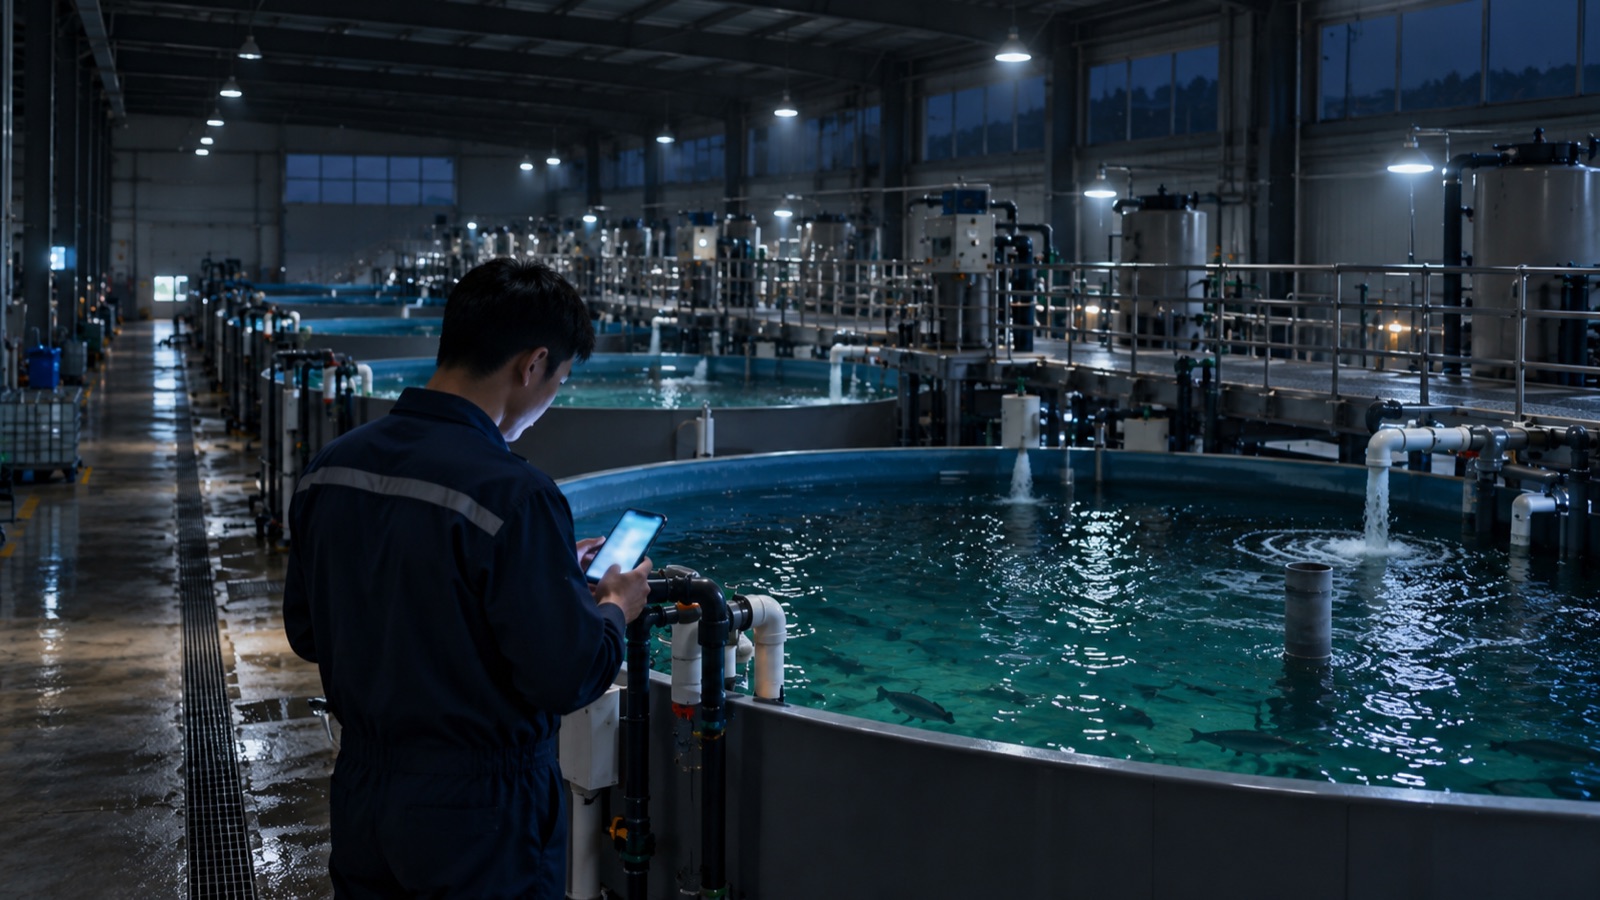
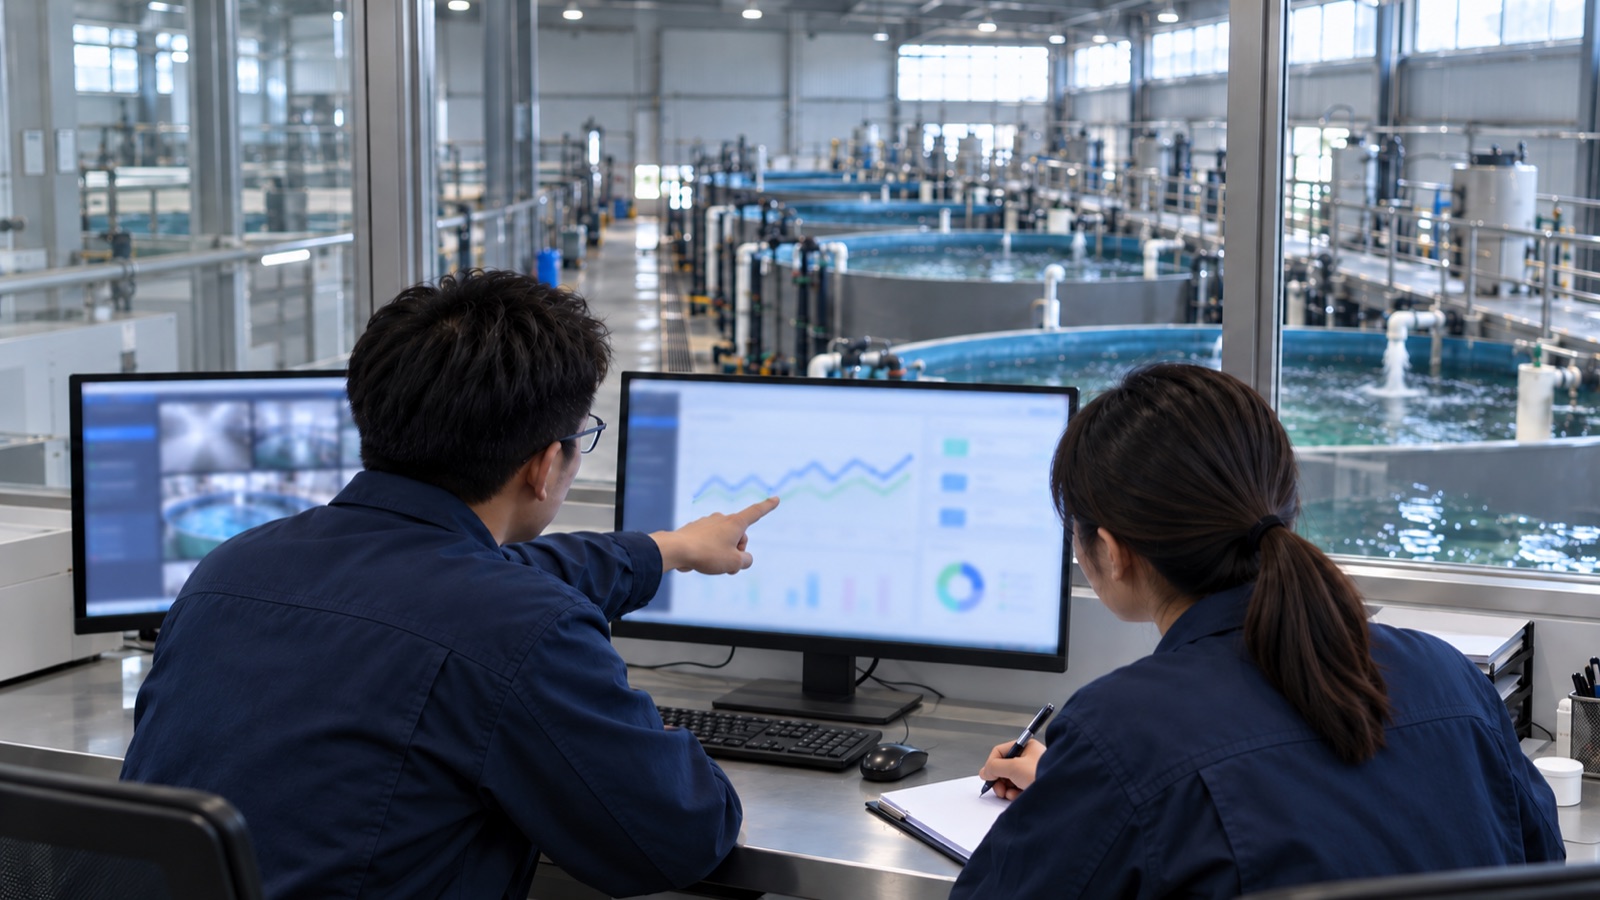
18 models, chosen around your needsWater, fish, production, equipment and knowledge
Start at zero software costKeep adapting until accuracy meets agreed site targets or the agreed period ends
In-depth joint evaluation on siteEvaluation criteria are jointly agreed
Zero software cost applies until the targets are met or the agreed period ends, whichever comes first; after that, continued use is paid. Hardware, sensors, installation and on-site support are discussed separately for each project.
Model collaboration · The film
See how the models work together
A day and night in a recirculating aquaculture system
Woody on Watch
Follow observation, measurement, forecasting and advice through one aquaculture story. Each model has a defined role. People retain responsibility for decisions and action, while site feedback guides the next improvement.
Click the poster to watch
Our approach · The site shapes the answer
Accuracy isn't a factory setting. It's grown on site.
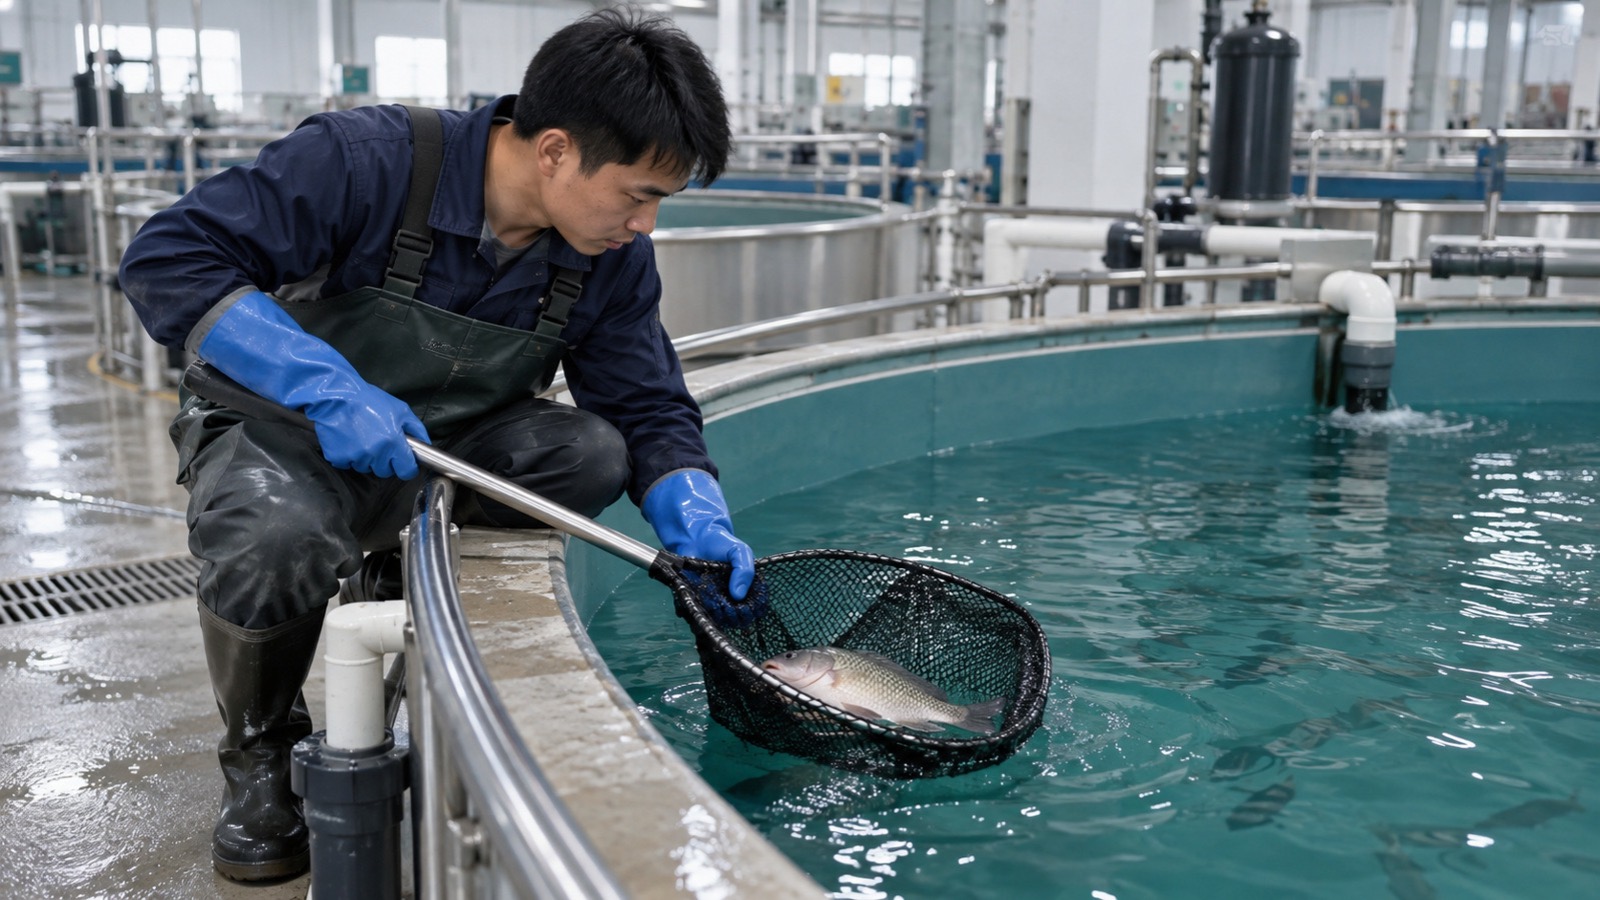
Water readings: a real change or a drifting probe?
Feeding decisions: do fish activity and water conditions agree?
Daily checks: which changes need attention first?
Farm knowledge: are advice and outcomes recorded?
There is no out-of-the-box accuracy in aquaculture AI. Move the same algorithm to another region, another water source or another species, and its performance can change completely — which is why there are so many algorithms today, yet their accuracy on real farms is so often low. We believe aquaculture AI should not be a standard product, but a process in which a service becomes a product. That is why GW-OCEAN is launching its Aquaculture AI Productization Service: start at zero software cost, keep optimising on your site, until accuracy meets your targets or the agreed period ends.
Zero software cost applies until the targets are met or the agreed period ends, whichever comes first; after that, continued use is paid. Hardware, sensors, installation and on-site support are discussed separately for each project.
Region, water source, species, seasons and process conditions can all change the meaning of the same data. We check inputs with site staff, record differences and review advice so that useful judgements develop through sustained work.
The collaboration path · Connect decisions and action
From data to suggestions and review
Each model handles a defined task, connecting observation, forecasting, advice and review. Models share information; site teams retain responsibility for action.
Site
Site data
Water, images, feeding, equipment and intervention records.
Check
Quality and observation
Check readings, observe fish and keep reliable evidence.
Advise
Forecasts and advice
Combine findings into trends, risks and a sequence of checks.
People
Human review and action
Staff confirm the response; people and existing control systems carry it out.
Feedback
Record and review
Record actual actions and outcomes to guide the next improvement.
Reviewed intervention outcomes return to knowledge and review, informing risk assessments and future scenario comparisons.
Collaboration diagram · Information and review relationships
AI alerts are advice for staff to assess. Existing safety interlocks and site response permissions remain independently effective.
Health diagnosis and treatment belong to qualified personnel. When information is insufficient, further checks are requested.
No system replacement
We do not lock you in or replace your existing business systems, databases or video platforms; we only read data from them and never write to them. Integration with your existing systems is included on the software side.
On-site inference
Day-to-day inference runs on site and does not depend on an internet connection. Integration and model inference both run in the AI zone deployed at your site.
Separate from control systems
There is no network route between the AI zone and the control systems. AI only provides advice; site staff and existing control systems remain responsible for action.
The model landscape · Organised around site needs
A coordinated set of 18 models
Choose data and coordinated models around six types of site needs. Begin with a priority scenario, then extend the work as data and objectives develop.
Cite reviewed procedures and explain how similar records apply to the situation.
M13
Intervention Outcome & Causal Analysis
Link actual interventions to outcomes, examining evidence and uncertainty.
The 18 models describe the capability catalogue and can be introduced selectively. Inputs, review responsibilities and scope of use are agreed for the site.
Check first. Then look ahead.
Water quality and risk
Check first. Then look ahead.
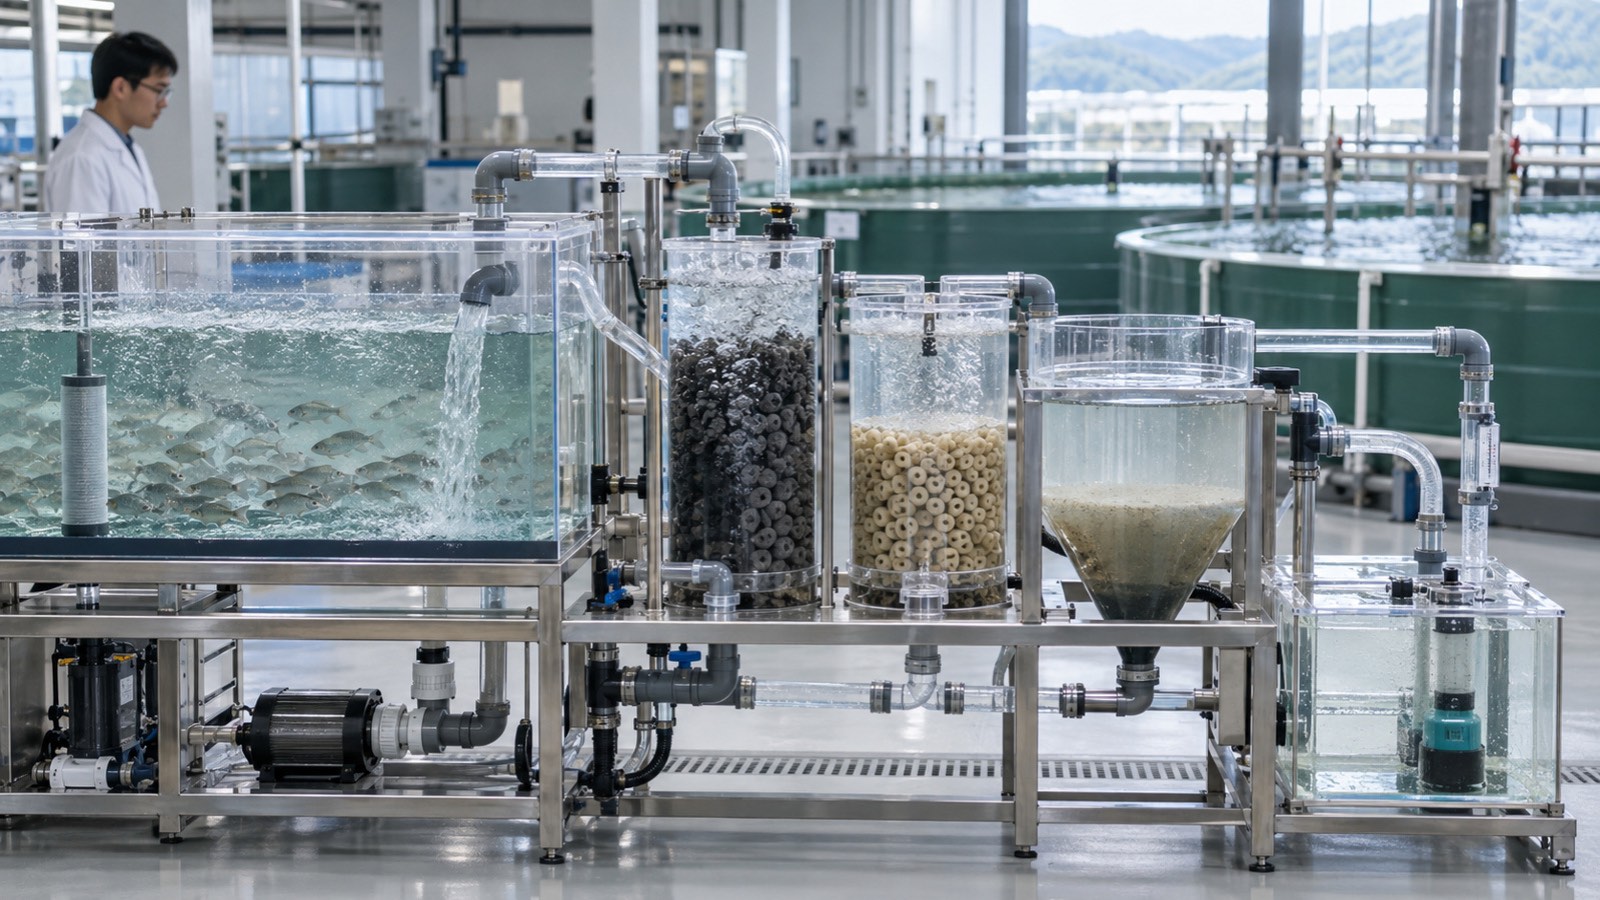
Distinguish real water changes from sensor faults, then use checked readings to assess trends and estimate indicators between laboratory tests. Water, fish behaviour and equipment findings form reviewable risk assessments and checklists, helping staff understand what needs attention and what to check first.
Site inputs
Water readings, calibration and laboratory checks, feeding and flow records, equipment conditions and reviewed procedures.
What it provides
Data-quality indications, trends and estimated ranges, risk findings, possible causes and suggested checks.
Checked inputs→Trends and estimates→Risks and checks
Critical water indicators remain subject to sensor and laboratory checks. Soft sensing adds continuity; staff confirm any response.
Connect fish, feed and records.
Feeding and growth
Connect fish, feed and records.
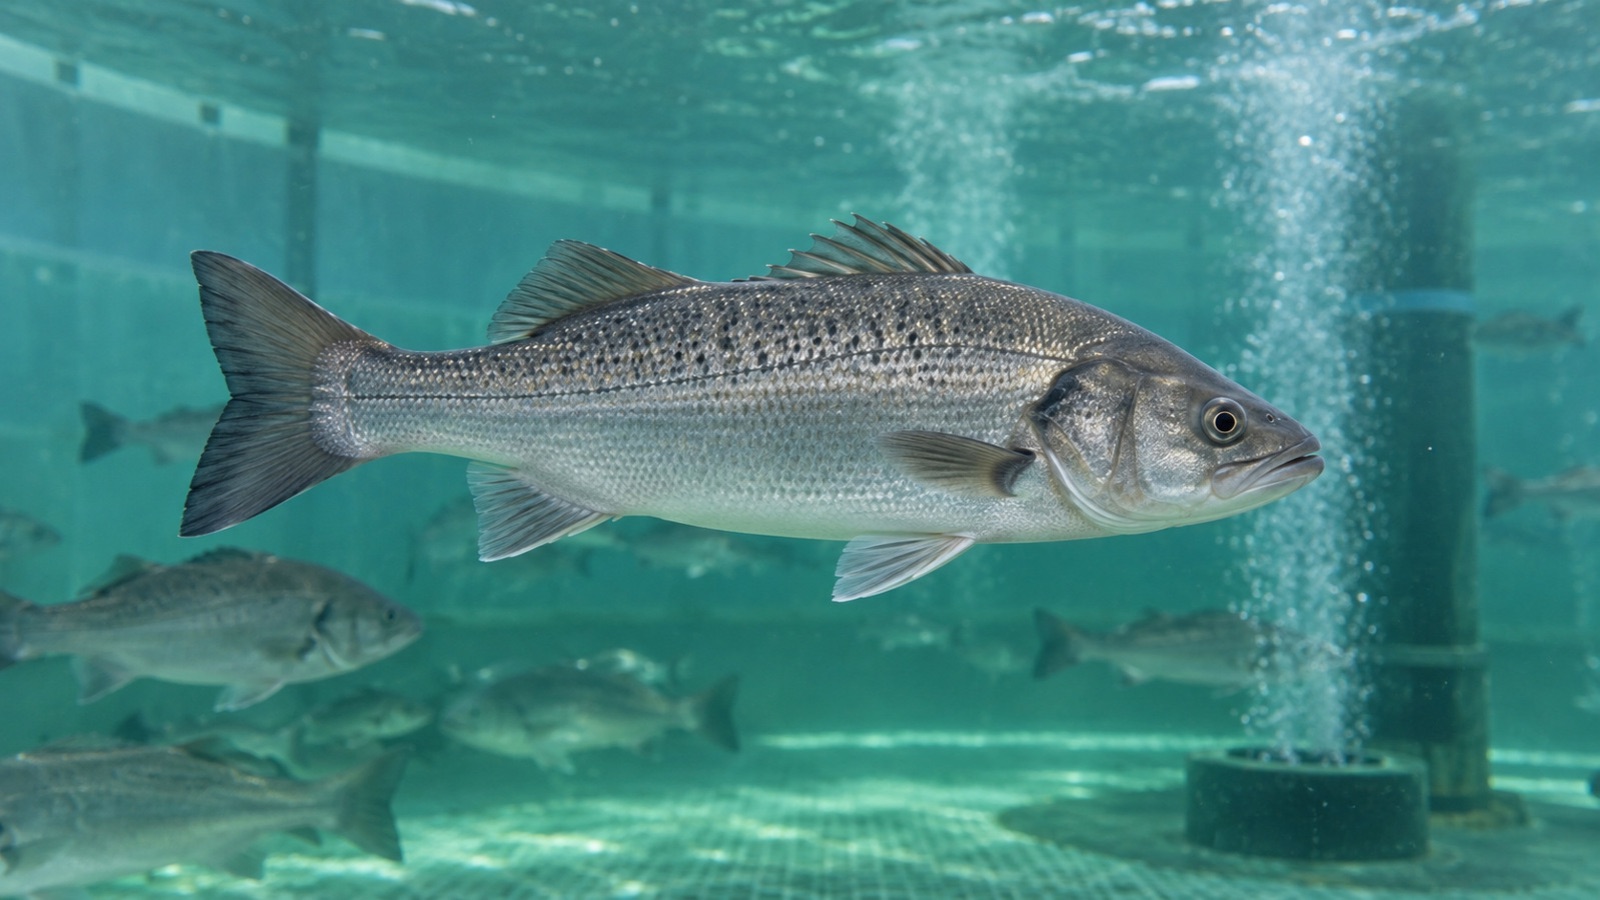
Fish size and biomass provide a basis for feeding, while feeding behaviour and water quality provide current context. Reviewed feeding plans, actual feed and stock changes support feeding decisions and growth assessment, with advice compared against production records over time.
Site inputs
Stereo images, manual size and weight checks, species and feeding plans, feeding activity, water conditions and complete batch records.
What it provides
Size and biomass estimates, feed quantity and timing advice, growth trends, feed conversion ratio and yield ranges.
Size and biomass→Feeding advice→Records and growth
Water safety takes priority. Staff confirm feeding, and actual actions and stock changes are recorded. Yield forecasts provide an assessment range.
Observe with evidence. Review with context.
Visual fish observation and health
Observe with evidence. Review with context.
Different models observe feeding changes, visible health concerns, species and suspected mortality. Images are retained with the time and location of events, alongside water, feeding and manual checks, to support focused review by site staff.
Site inputs
Tank video and close-up images, camera and observation-area information, reviewed species references, feeding periods and examination records.
What it provides
Behaviour events, species indications, suspected anomalies, sustained image evidence and suggestions for further checks.
Image observation→Events and evidence→Human review
AI provides health clues; qualified personnel decide on diagnosis and medication. Suspected mortality enters production records only after human confirmation.
Keep safety first when comparing plans.
Equipment and energy
Keep safety first when comparing plans.
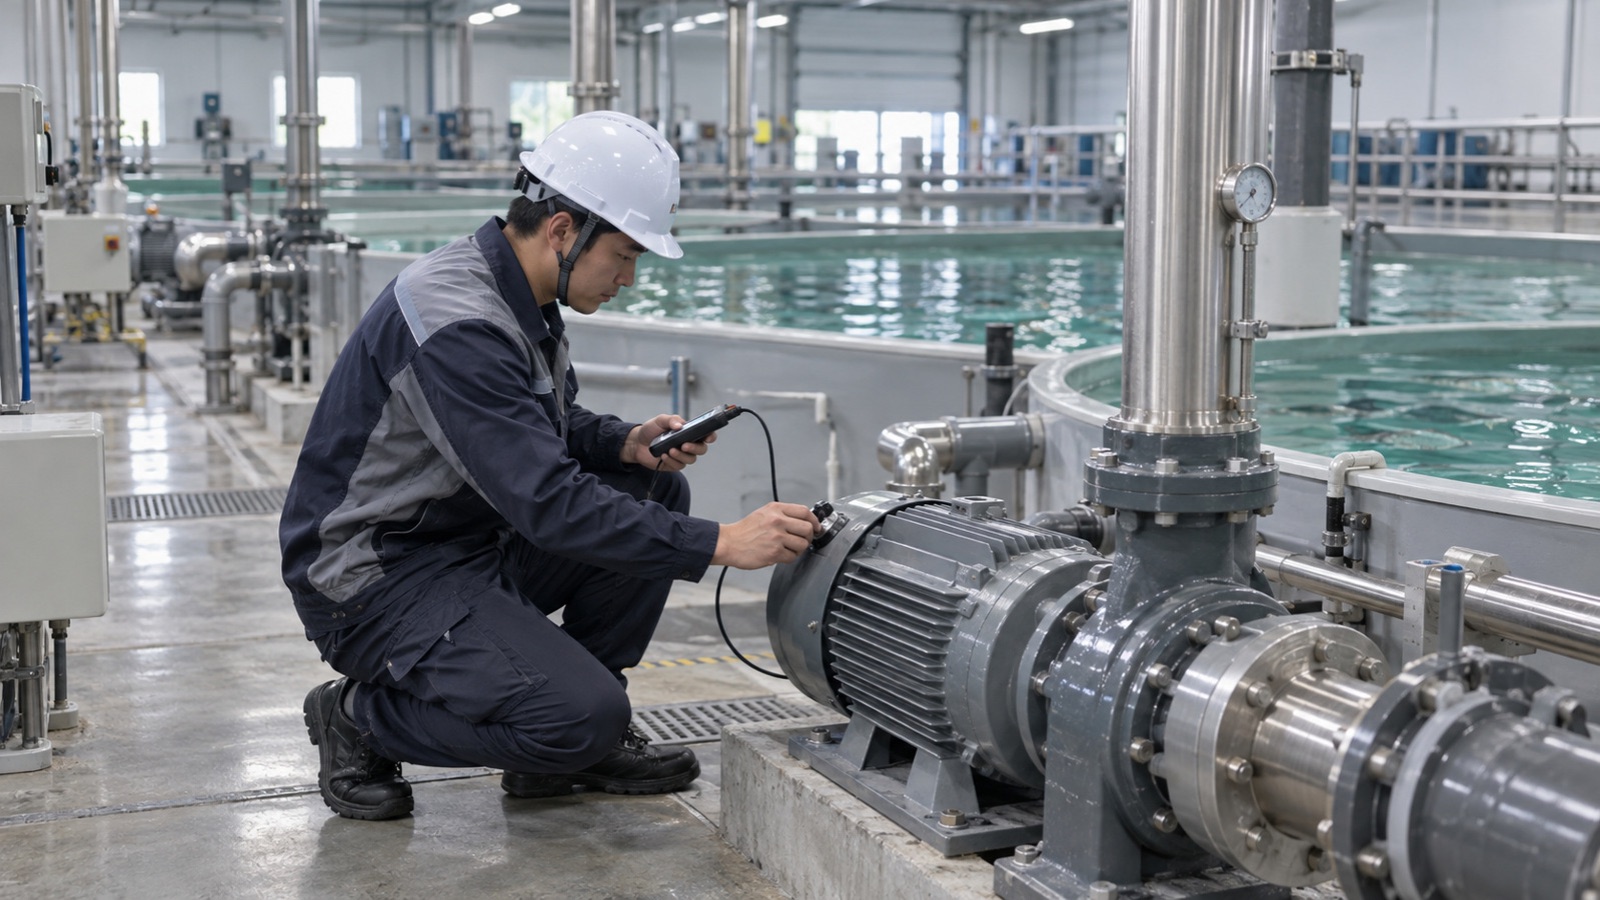
Equipment conditions and maintenance records for pumps, blowers, filtration and temperature control support fault evidence and maintenance priorities. Metered energy and process loads inform energy baselines and operating-plan comparisons for staff to review within aquaculture safety constraints.
Site inputs
Current, power, vibration, temperature, flow, pressure differences, metered energy and maintenance records.
What it provides
Anomalies and possible faults, maintenance checklists, load assessments and constrained operating-plan options.
Equipment condition→Maintenance evidence→Load and plan comparison
Water, equipment and backup requirements guide comparisons. Basic energy analysis can start with metering; further simulation is selected around site needs.
Understand changes before reviewing plans.
Compare strategies in simulation
Understand changes before reviewing plans.
The digital twin brings process layouts, equipment curves, biomass and water conditions into scenarios, exploring how the system responds to changes in flow, feeding or oxygen supply. Constrained candidate plans and research strategies are compared in simulation to support discussions about site plans.
Site inputs
Site process and equipment parameters, flow, water quality, biomass, forecasts and safety and backup requirements.
What it provides
State estimates, scenario trajectories, constrained candidate plans and evidence for strategy comparisons.
Process scenarios→Constrained plans→Isolated strategy comparison
Constrained rolling optimisation and the reinforcement learning research sandbox remain within simulation and isolated comparison. Research strategies do not enter site execution.
Advice with sources. Improvement with evidence.
Keep evidence and knowledge at the farm
Advice with sources. Improvement with evidence.
Reviewed procedures and customer-authorised historical records provide traceable references, explaining how the current situation differs from similar records. Actual actions, execution records and subsequent outcomes are connected for review, giving future decisions clearer context.
Site inputs
Reviewed knowledge, alerts and trends, equipment information, conditions before and after intervention, actual actions and outcome records.
What it provides
Cited procedures, similar records and applicability differences, checklists and analysis of intervention outcomes.
Reviewed knowledge→Actions and outcomes→Review and feedback
Knowledge is jointly prepared with customer authorisation and review. Outcome analysis considers other changes and uncertainty, requesting further comparison when needed.
The service · From sustained work to a product
Aquaculture AI Productization Service
Start with the site need that has the strongest data foundation and business relevance. Agree objectives, inputs, review responsibilities and an improvement path, so each round of feedback informs the next. Getting started takes just three things: a clear business problem, one kind of record that can be checked, and a person who can review the results.
Start at zero software cost
For the agreed aquaculture site, our Aquaculture AI Productization Service starts at zero software cost and remains free on the software side throughout site adaptation and continuous optimisation until accuracy meets the targets jointly agreed for that site or the agreed period ends. Hardware, sensors, installation, on-site support and other supporting items are discussed separately for each project.
Site assessment
GW-OCEAN reviews needs, processes and data; you share species, priorities and site requirements.
Stage output: Needs, scope and data conditions
Joint data preparation
Together we prepare authorised records, align timing and definitions, and arrange annotation, laboratory checks and human review.
Stage output: Agreed data definitions and quality records
Site adaptation
We combine models around selected scenarios and adapt them to site parameters; you review whether results and advice are useful.
Stage output: Site model combination, boundaries and evaluation plan
Continuous optimisation
We analyse differences and improve models and knowledge; you share anomalies and response outcomes and review evaluations with us.
Stage output: Continuous comparison and improvement against agreed criteria
Product definition after acceptance
We bring together acceptance evidence, or the evaluation findings when the agreed period ends, then agree the formal product arrangements together.
Stage output: Acceptance records or end-of-period evaluation findings, and formal product arrangements
Service workflow · The starting point is agreed around site conditions
Once the agreed site targets are met or the agreed period ends, if you choose to keep using the models, continued use is paid; we agree together on the formal product and how it is charged.
Joint evaluation · Define value around the site
Agree how value is evaluated
Agree what good means, then work towards it together. Evaluation criteria are jointly agreed, with ongoing comparisons shaped by site needs.
Agree the conditions for evaluation
Define the target site, species and environment, then agree the intended use, data sources, comparison basis and evaluation period. Agree human review responsibilities, scope and site-specific thresholds, retaining evidence of improvement and the basis for judgements.
Safety and anomalies
Are findings timely and alerts useful for human review?
Feeding and production
Is feeding advice useful, and does growth assessment align with records?
Equipment and energy
Do maintenance evidence and load assessments support plan comparisons?
Knowledge and review
Can procedures be traced and actual actions linked to outcomes?
These are directions for joint evaluation. Specific criteria are jointly agreed, for example alert lead time, false and missed alerts, length-measurement deviation and advice adoption rate. After each round, record differences, review findings and the next improvements.
Work with GW-OCEAN · Start on site
Start with your site needs
Bring your aquaculture needs to GW-OCEAN. Together we can choose a priority scenario, agree evaluation targets and begin in-depth joint evaluation on site. Start with your species, processes, available data and the problem you most want to address.